The Famine Ledger
Not weather — policy, counted. The numbers here belong to R.C. Dutt, an insider who ran famine relief himself and wrote it down where the empire could read it.
Ten famines in forty years
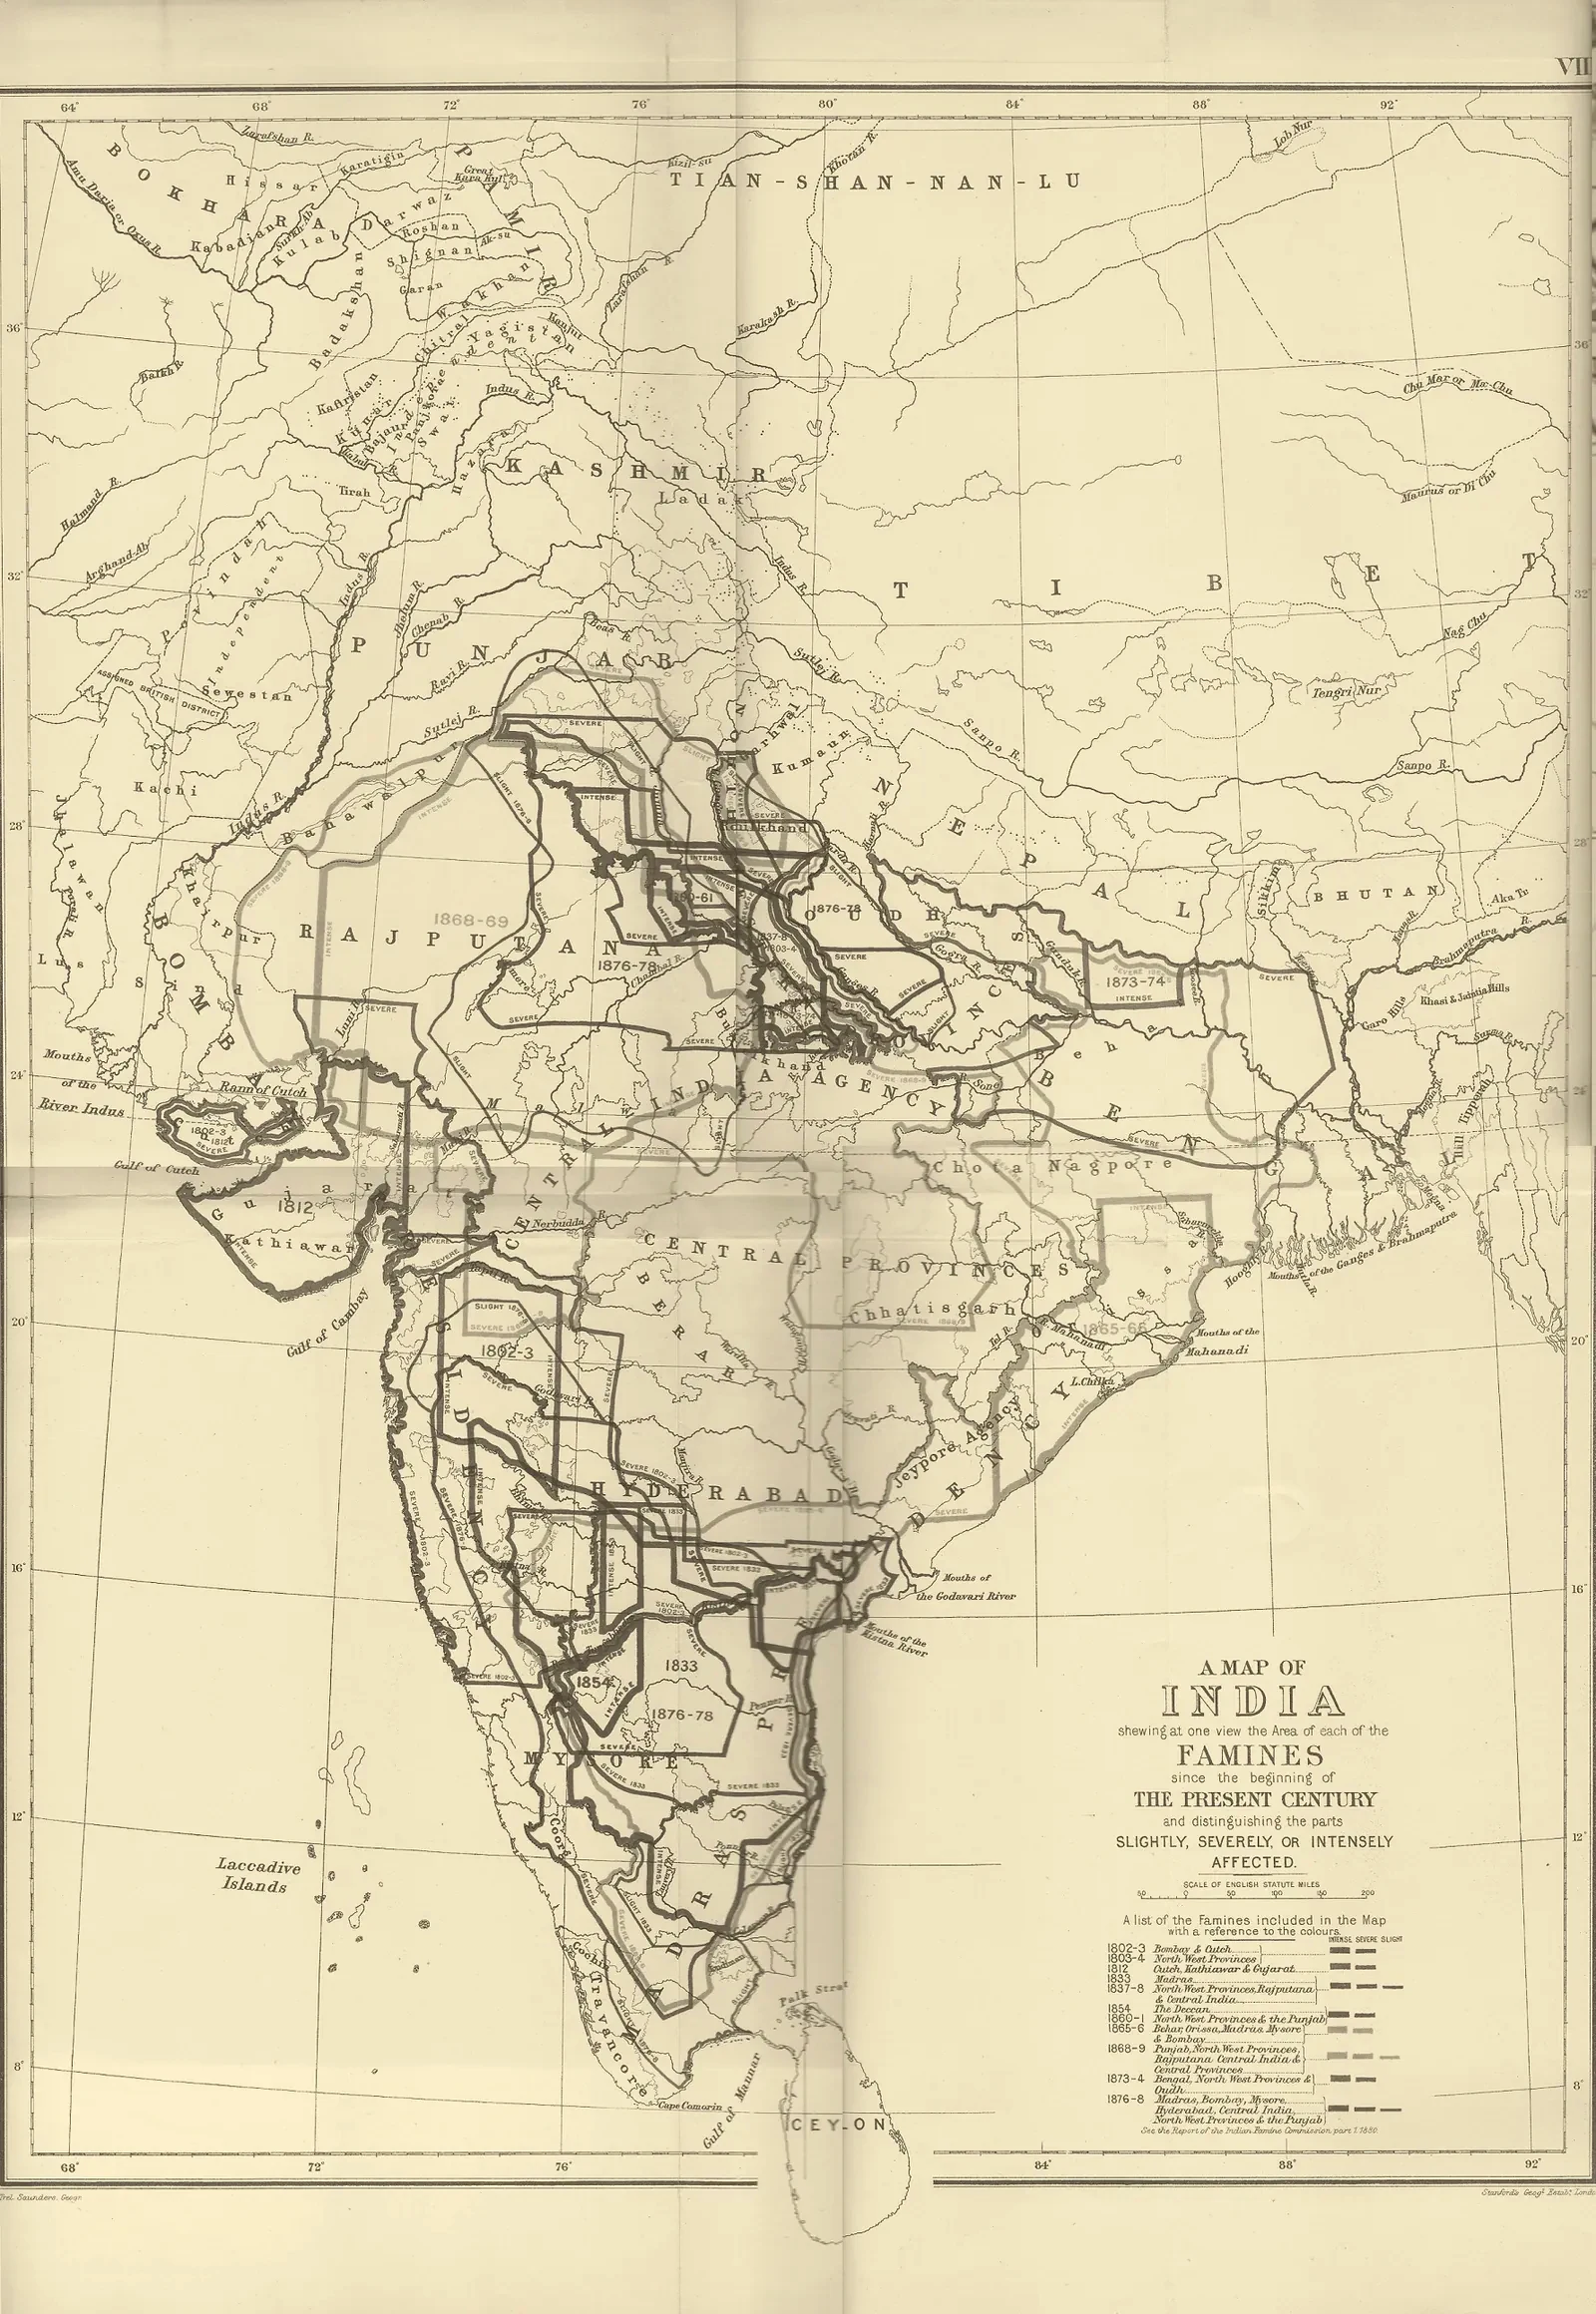
Run the ledger the way Dutt wrote it: 1860, Northern India, 200,000 and more. 1866, Orissa, a million — a third of the province. 1869, another 1.2 million. 1877, Madras, five million perished — the spike that towers over the whole record. 1878, 1889, 1892, 1897, and 1900 — “most wide-spread ever known,” six million relieved, and the phrase that survives the file is that people “died like flies.” A famine every four years, on average, for the length of a working life. Fifteen million dead in forty-two years of the mother’s care.
One man’s arithmetic, an insider’s, published under his own name in 1901. We use his numbers and no one else’s, because he was there and he counted.
The full plate — Ten Famines in Forty YearsThe two rows to read twice
1874, Bengal: same kind of drought as everywhere else, light and permanently-settled land tax — no loss of life. 1877, Madras: same kind of drought, heavy and ever-enhanced land tax — five million dead. Same sky. Opposite outcomes. The difference was policy, not rain. Dutt — who ran famine relief himself, and who set the two years side by side in his own ledger — left the columns to make the argument. The Bose Boys reading: when the same sky produces no deaths under a fixed tax and five million under a rising one, the tax is not a background condition. It is the instrument.
Behind the tax, the wider machine: roughly half of India’s net revenues leaving the country every year — a drain, Dutt called it, unexampled in any country on earth. What it meant at street level: no capital for an instrument industry, no fund for a science institute, no cushion when prices crashed. Every builder in this library built against this current.
The Evidence Room — the numbers, sourced1931: the ledger’s last entry
Then the Depression arrives and leans on the old design with its whole weight. Prices halve in two years — the agricultural index falls from 203 to 127, wheat and jute lose more than half their value — and the land tax does not move a rupee. So the peasant does the last thing left to do: sells the gold. The bangles, the dowry, the only wealth a poor family holds. Roughly sixteen hundred ounces a day flow into the port of Bombay and out to London, and a British economy in crisis is quietly propped up on the dissolved savings of the Indian poor.
It is the exact knife the founders saw in 1858 — a fixed demand on a people who cannot save. And P.C. Ray had written the prescription thirty years before the crash: the cure is a factory, not a slogan; stop the drain the day you can make what you used to be forced to buy. Two ways to read 1931, both true: prisoners freed by a handshake, and bangles melted in ten thousand villages.
Where this thread runs
The ledger, dated
- 1860–1900Ten famines; ~15 million dead by Dutt’s count — the plate.
- 1874 / 1877The natural experiment: Bengal’s light tax, no deaths; Madras’s heavy tax, five million.
- 1901Dutt publishes Indian Famines under his own name.
- 1929–31Prices halve; the tax holds; distress gold flows at 1,600 oz a day — S4 · E3.
Named sources
- R.C. Dutt, Indian Famines: Their Causes and Prevention (King & Son, Westminster, 1901) — the verbatim spine of every number above.
- The episode record, The Distress Gold (S4 · E3) — the 1929–31 figures.
- The Evidence Room (/charts) — all plates, sourced and dated.
House rule: numbers arrive with their author’s name attached, and we correct in public. The method is on the About page →